

Finance & Operations Dashboards
Turn Business Data Into Decision Intelligence.
BEV designs professional Power BI and business intelligence solutions that connect financial and operational information to the decisions leadership needs to make. From executive financial reporting to projects, locations, workflow, responsibilities, and operational KPIs — every solution is built around the organization, not a generic template.
Finance & Operations Dashboards
Professional business intelligence solutions that turn financial and operational data into clear, decision-ready information. BEV designs dashboards and reporting environments around the questions leadership actually needs answered — from revenue, profitability, and cash flow to projects, locations, operations, workflow, responsibilities, and performance.
- Finance Dashboards
- Operations Dashboards
- Executive Reporting
- Project & Workflow Intelligence
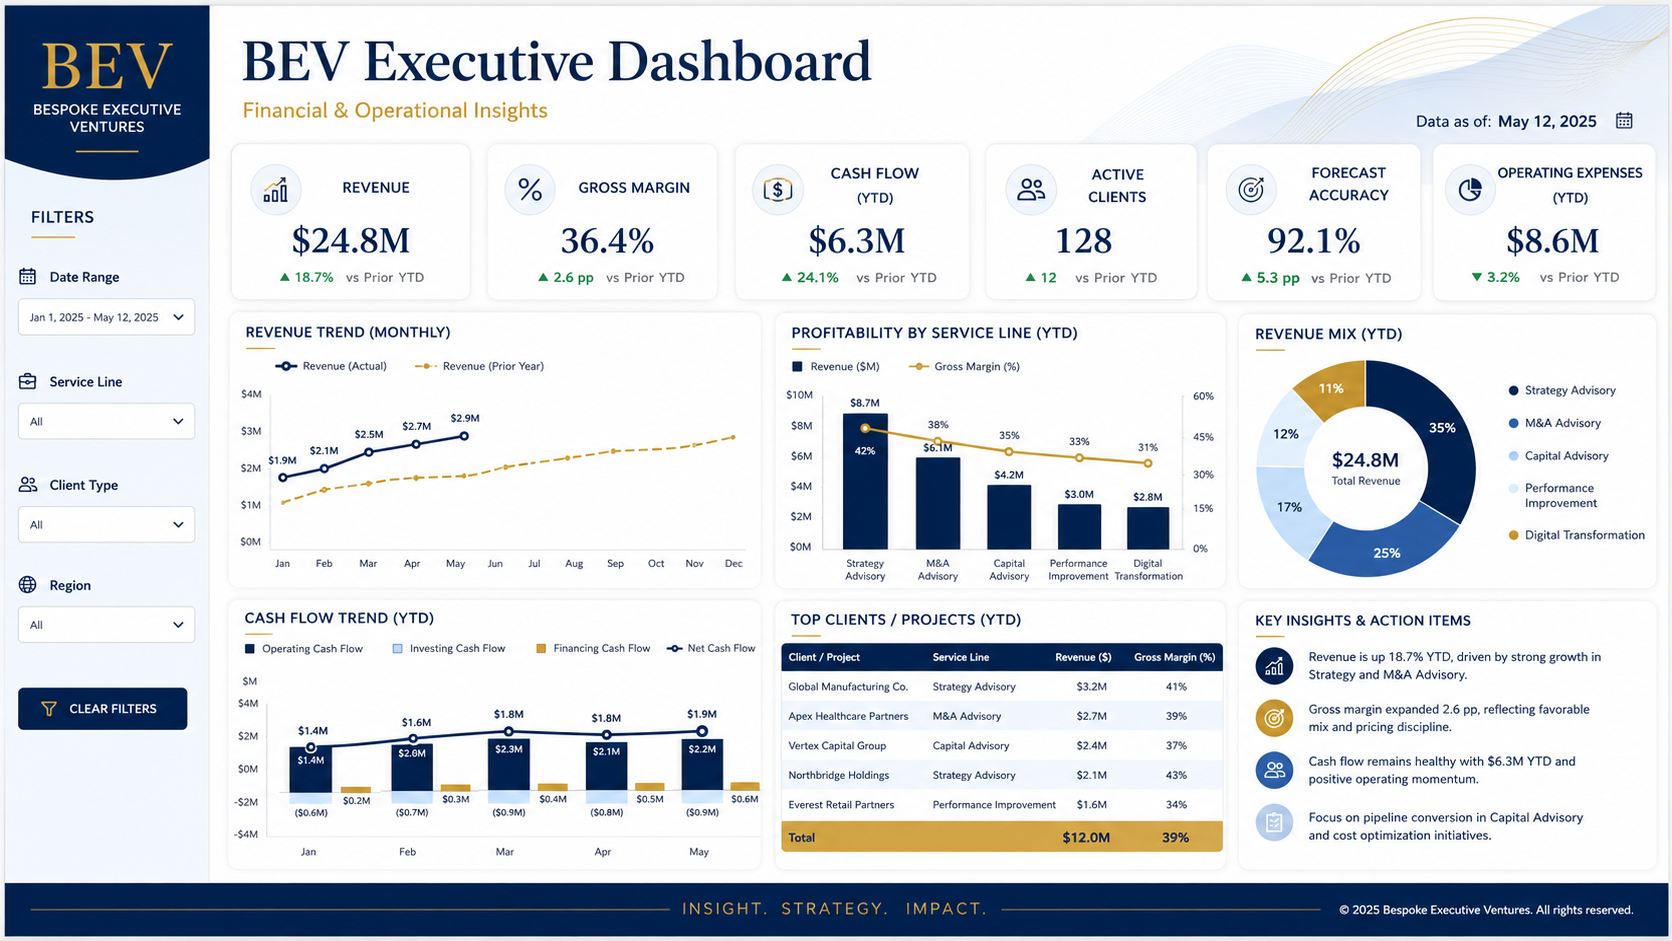
Your data records what happened. We build the view of what it means.
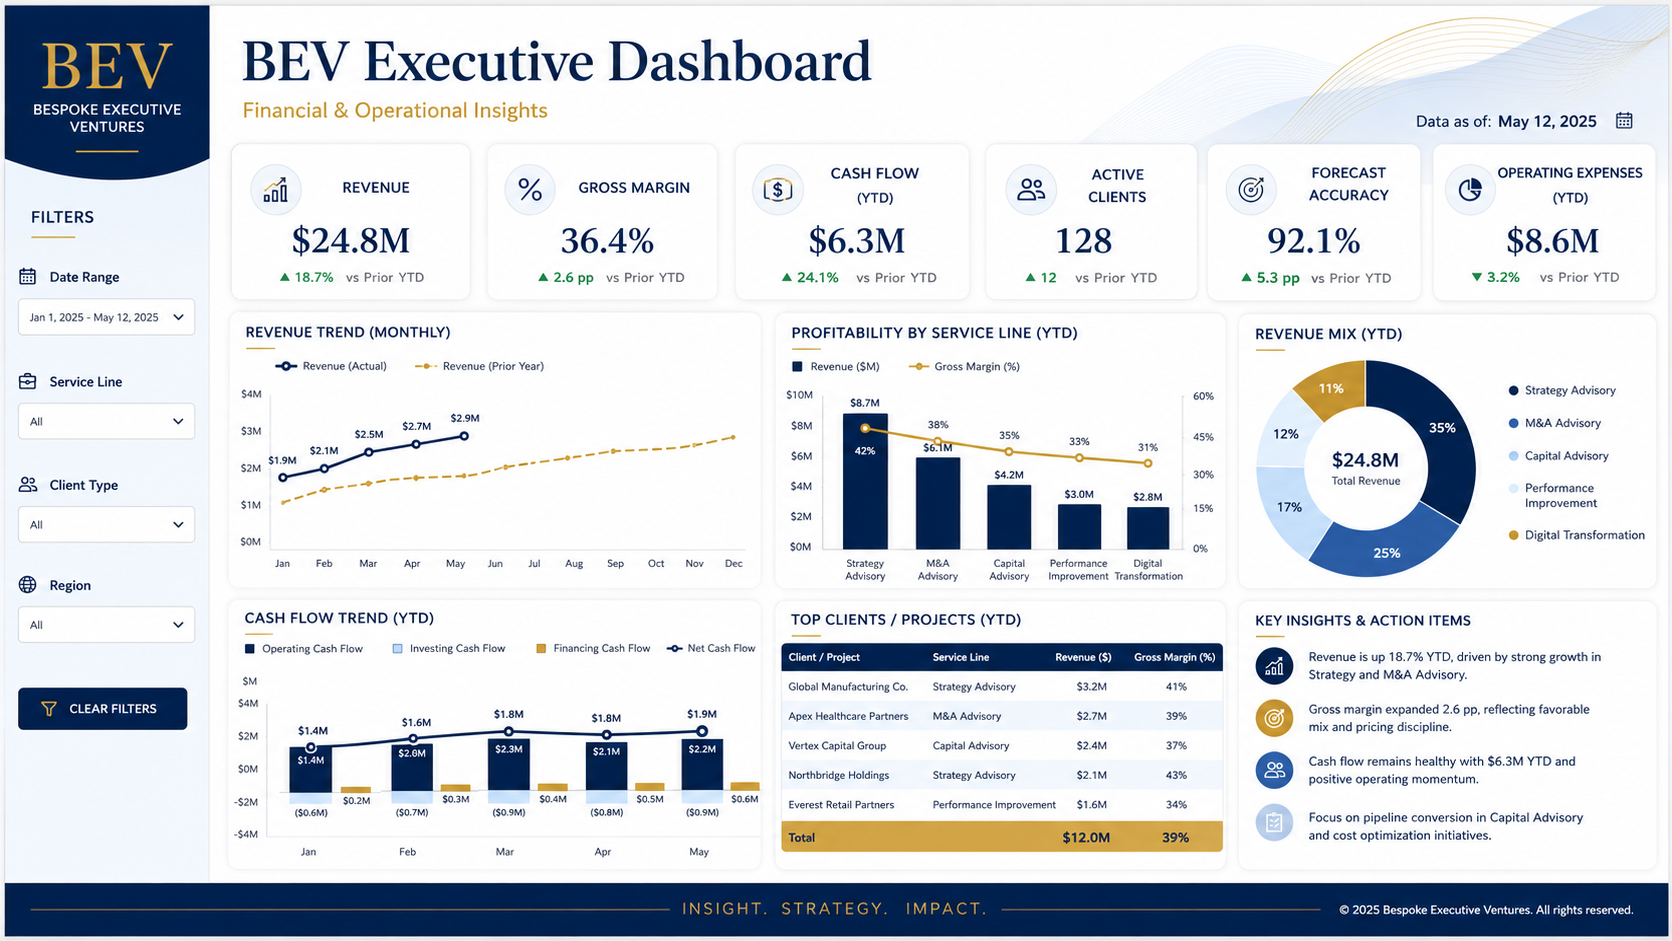
Every BEV dashboard is built around the questions leadership actually needs answered — not a generic template. Below are three examples of the types of intelligence environments we design.
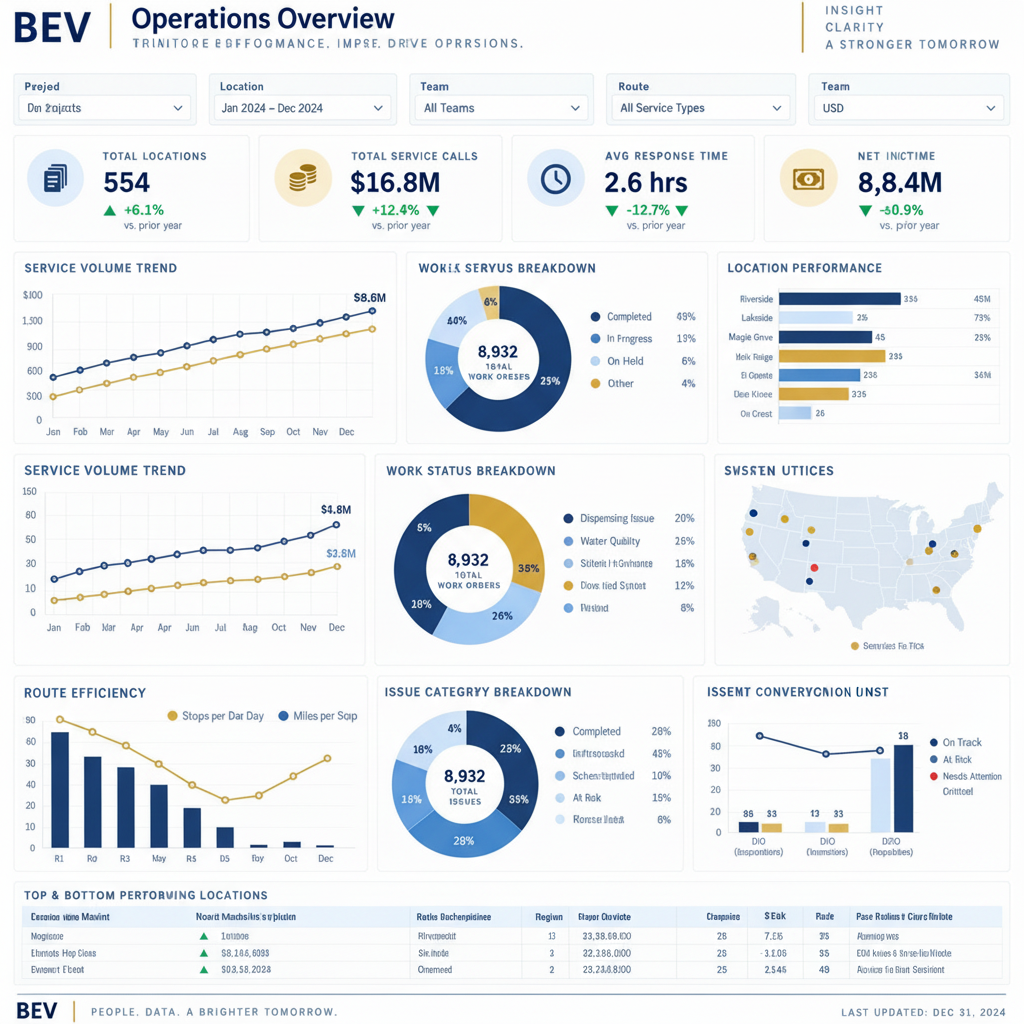
Operations Dashboard
Monitor Performance. Improve Service. Keep Operations Moving.
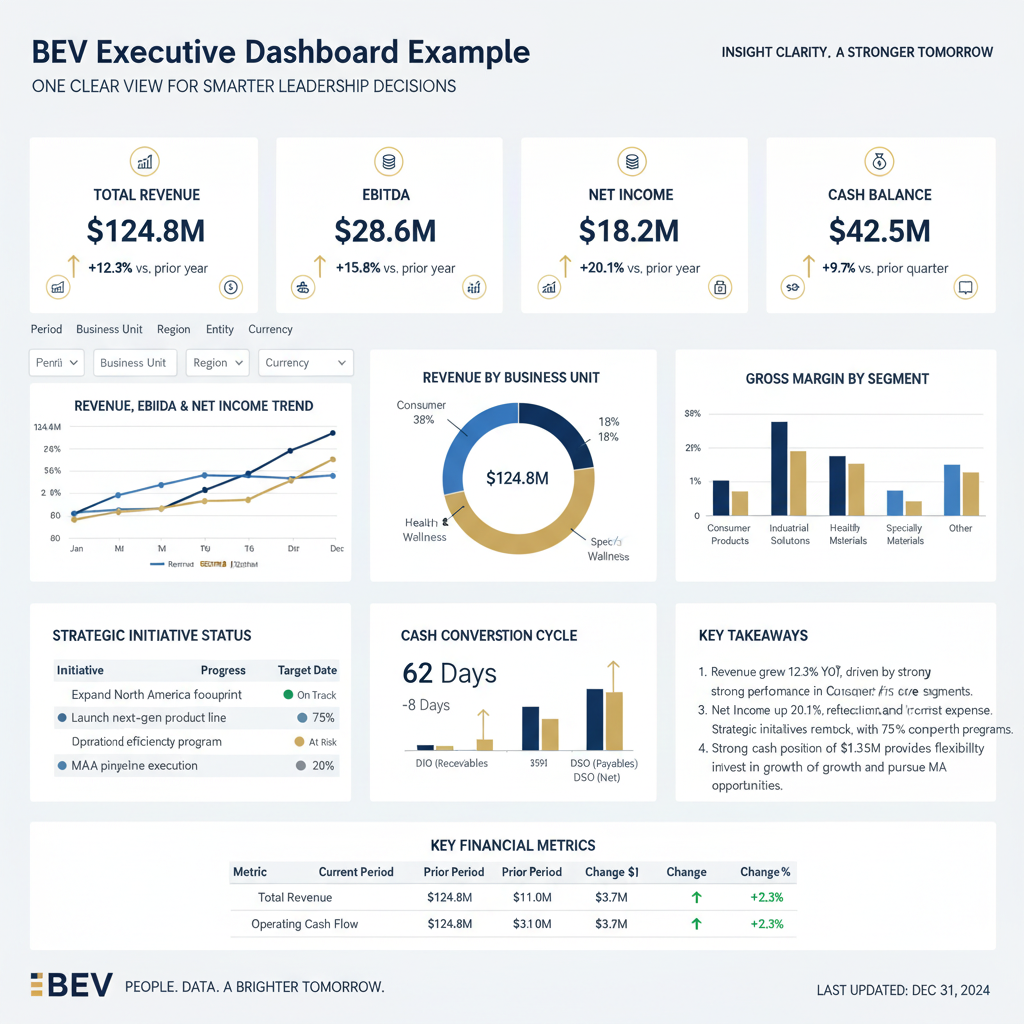
Executive Dashboard
One Clear View for Smarter Leadership Decisions.
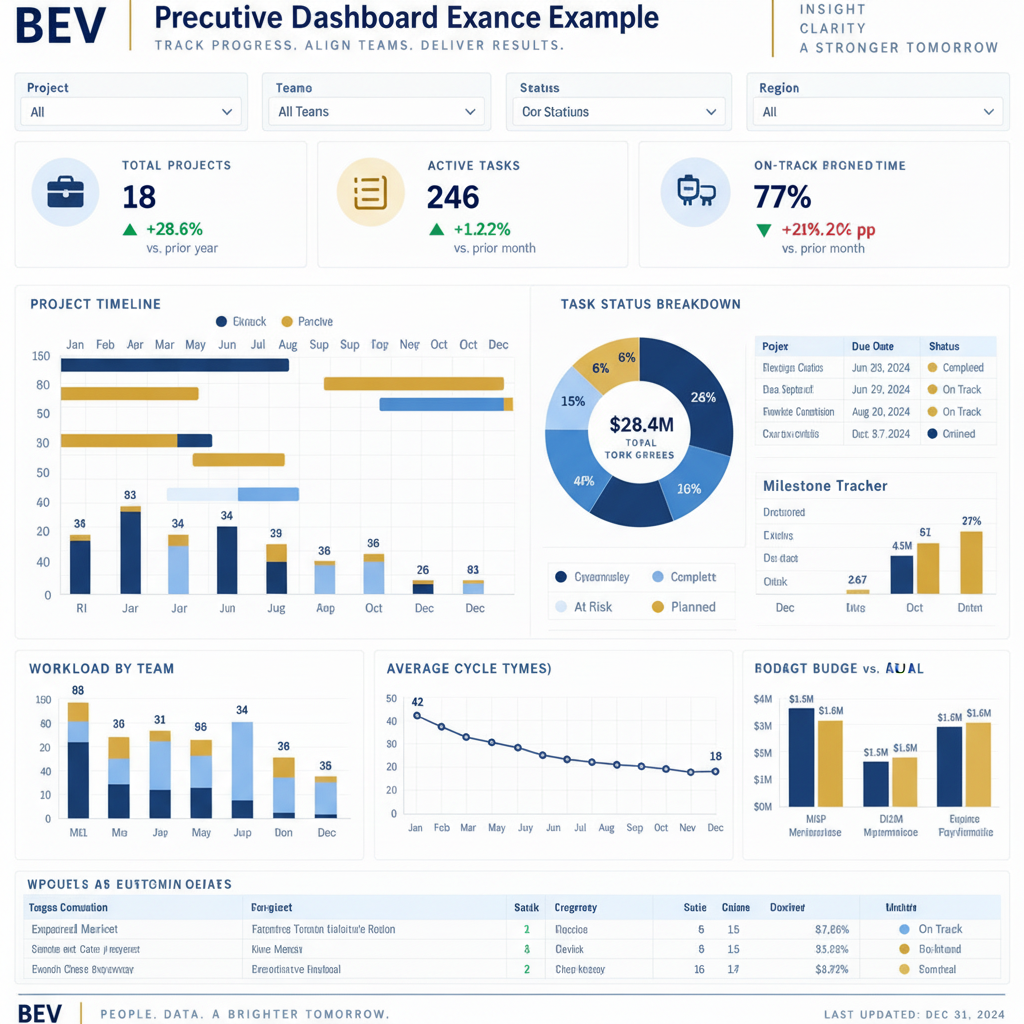
Project & Workflow Intelligence
Track Progress. Align Teams. Deliver Results.
Intelligence Built for Finance Leaders
Executive KPI Dashboards
Real-time visibility into the metrics that matter most — revenue, margin, cash, and operational performance — in a single view.
AI-Powered Insights
Automated anomaly detection, trend analysis, and forward-looking projections powered by AI to surface what needs your attention.
Board & Investor Reporting
Polished, board-ready financial packages and investor updates built from live data — no more manual spreadsheet assembly.
Automated Data Pipelines
Seamless integration with your ERP, CRM, and accounting systems to eliminate manual data entry and ensure accuracy.
Built for Every Audience
CEO & Board Visibility
A single source of truth for leadership — financial performance, operational metrics, and strategic KPIs in one place.
Investor & Lender Reporting
Automated, audit-ready reporting packages that build credibility with capital partners.
Department Performance
Drill-down dashboards for sales, operations, and finance teams to own their numbers.
From Raw Data to Real Decisions
- Custom dashboard design tailored to your business model and KPIs
- Integration with QuickBooks, NetSuite, Sage, Excel, CRM platforms, and operational systems
- Automated reporting with a refresh cadence appropriate to your systems and business needs
- Finance, operations, project, and executive views in a single environment
- Training and handoff so your team can own the tools
Stop Piecing the Business Together From Disconnected Reports.
Let BEV help you build a clearer view.